Introducing the Neighbourhood Needs Map
The Neighbourhood Needs Map is a free, easy-to-use and interactive resource. It helps to identify potential areas of deprivation across Surrey, allowing users to explore the data by theme and thereby guide funding discussions so that we can work with our communities to ensure grants will make the greatest impact.
Each themed map includes detailed data down to the street level, so you can see potential pockets of deprivation in specific areas. You can search and compare these visualisations by Local Authority District or by Ward, making it simple to understand how different areas are affected.
Select a theme from the list below
The following themes show key areas of deprivation within Surrey per theme. Each theme uses trusted datasets to highlight where challenges are most significant.
To create these themes, we have collected and collated over 1,000 datasets from trusted sources, including: the Office of National Statistics, Public Health England, and UK Government, of which a total of 147 lines of data were utilised in the development of the Neighbourhood Needs Tool as a whole
Please click the button below for further detail on the data used in these maps. We are aware that ONS data is due to be updated soon, so we will be updating these maps in due course too. Looking at the data is no substitute for working with communities and listening to their experiences, but hopefully this tool will help us to have many more useful collaborative conversations.
Every area in Surrey is assigned a total score based on this data. Each theme’s visualisation shows data at the Lower Super Output Area (LSOA) level, so users can see potential pockets of deprivation at a street level. The visualisations are searchable and comparable by Local Authority District and Ward, making it easy to understand where support could have the most impact.
Grants Awarded FY 2024-25
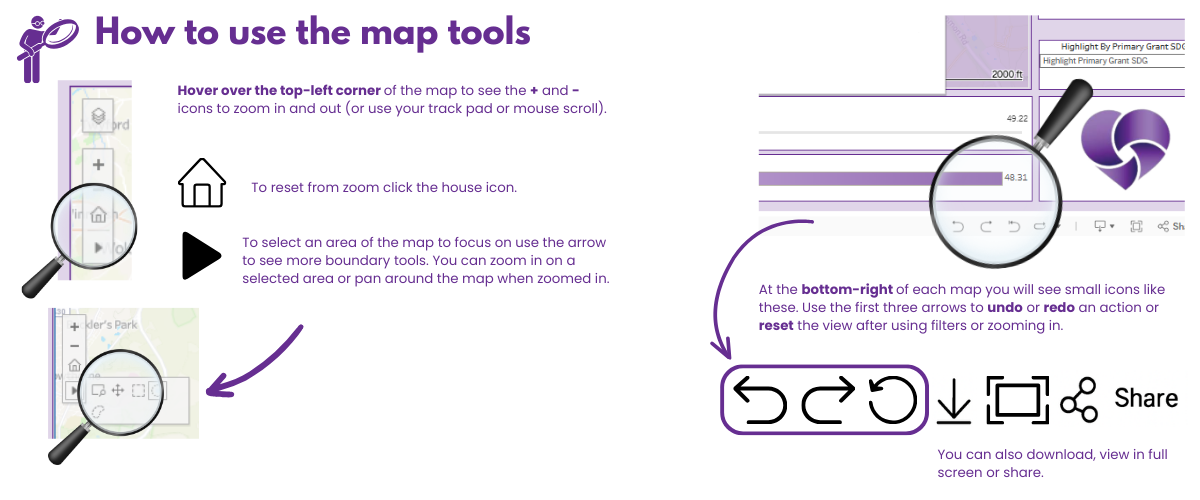
This map below shows a ‘heat map’ of all needs data. We have mapped onto it Grants awarded by CFSurrey in financial year 2024-25. You can search the map by area, by our Grant Programmes (see key below), and also by beneficiaries and issues. Note that the Primary Grant Beneficiary groups and Issues are chosen by the grant applicant at the time of applying for funding.
Below this map are buttons with links to four maps to spotlight Elmbridge, Tandridge, Waverley, and Mole Valley showing our grants awarded data from 2024-25 overlaying the most up to date overall needs data for the areas.
Key:
We value your feedback
We will be hosting the Neighbourhoods Needs Map on our website for a trial period and we would really value your feedback on your experience when using these maps - how easy are they to use, how easy the data is to understand etc… This will allow us to revisit and improve functionality once the trial period has ended.
Please click below to submit your feedback. Thank you!
The Data Behind Our Impact
We are proud to support hundreds of community groups across Surrey each year. Over the last 20 years we have awarded £23.6 million in funding, delivering 5,639 grants and reaching more than 1.29 million people across the county.
Our impact is only possible through the generosity of our donors. Together, we address a wide range of needs within Surrey — from mental health and wellbeing, sport and physical activity, and opportunities for young people, to protecting the environment, supporting the arts, helping disadvantaged individuals, and opening pathways into training and employment.
We were delighted to work in partnership with Social Research Builders in 2025 to compile an Impact Report detailing our grantmaking and the hidden need in Surrey.


